
IoT Lab 8
- PMARINA
- Nov 26, 2020
- 1 min read
8A:
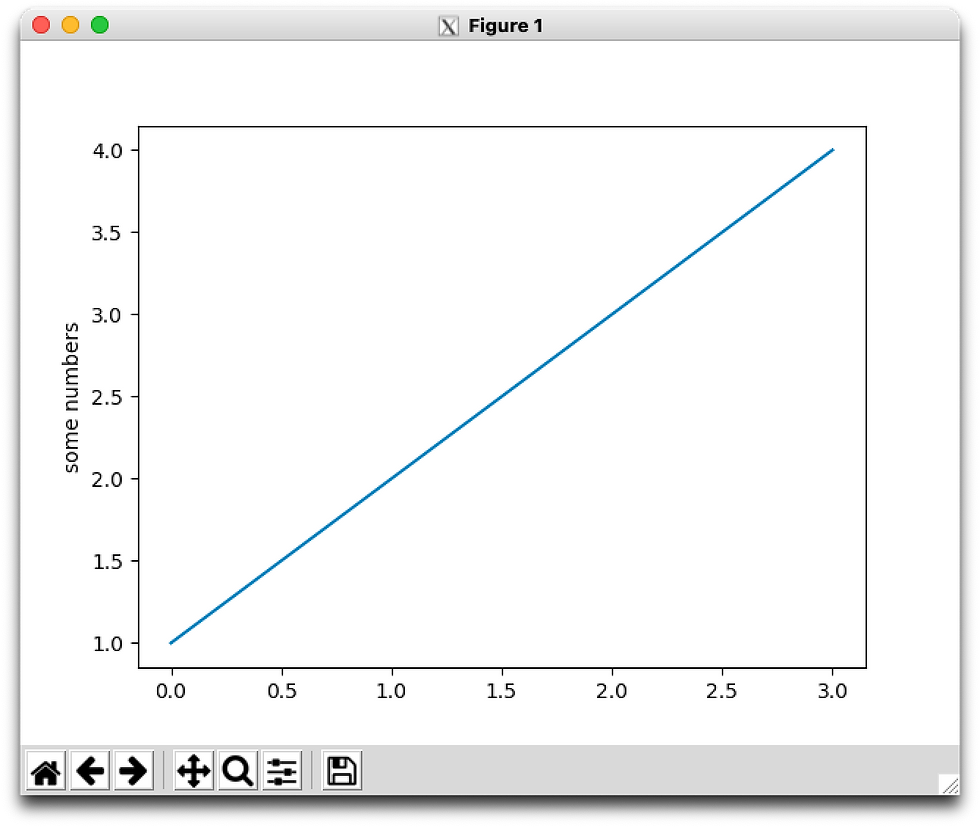
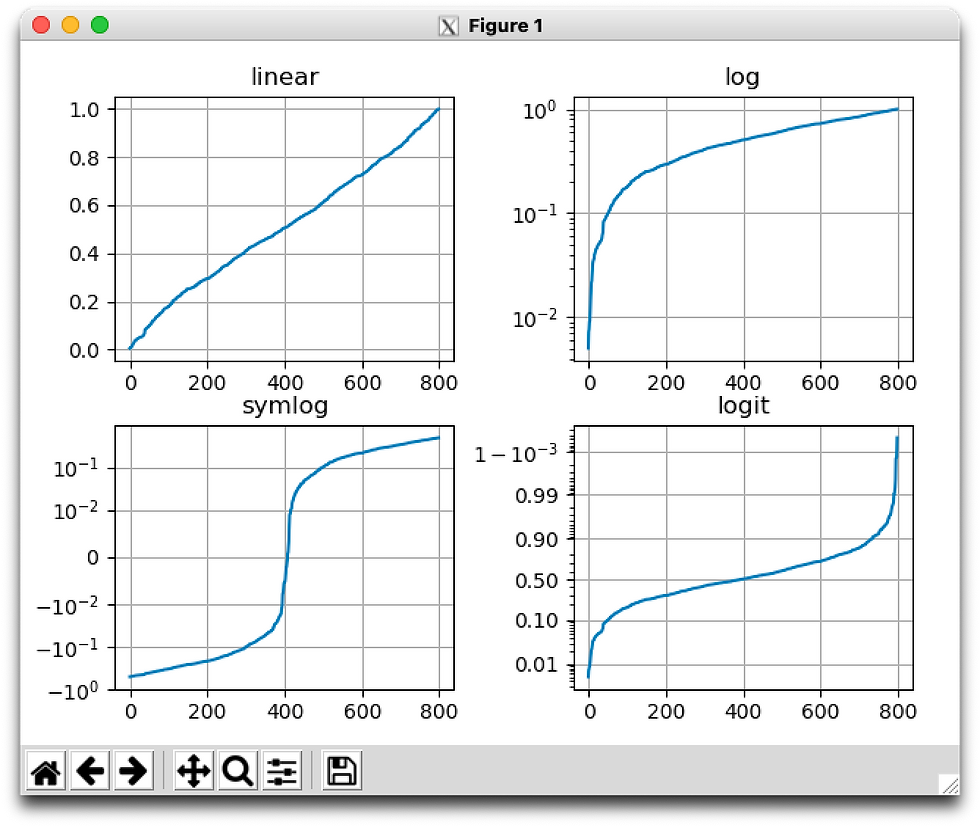
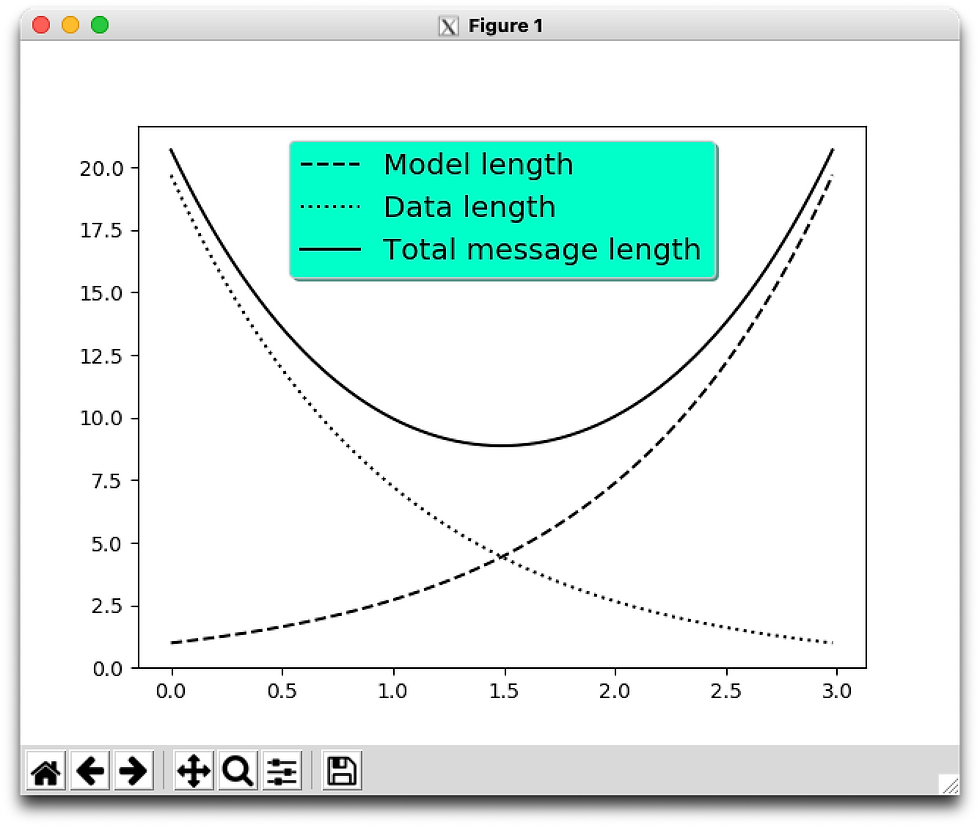
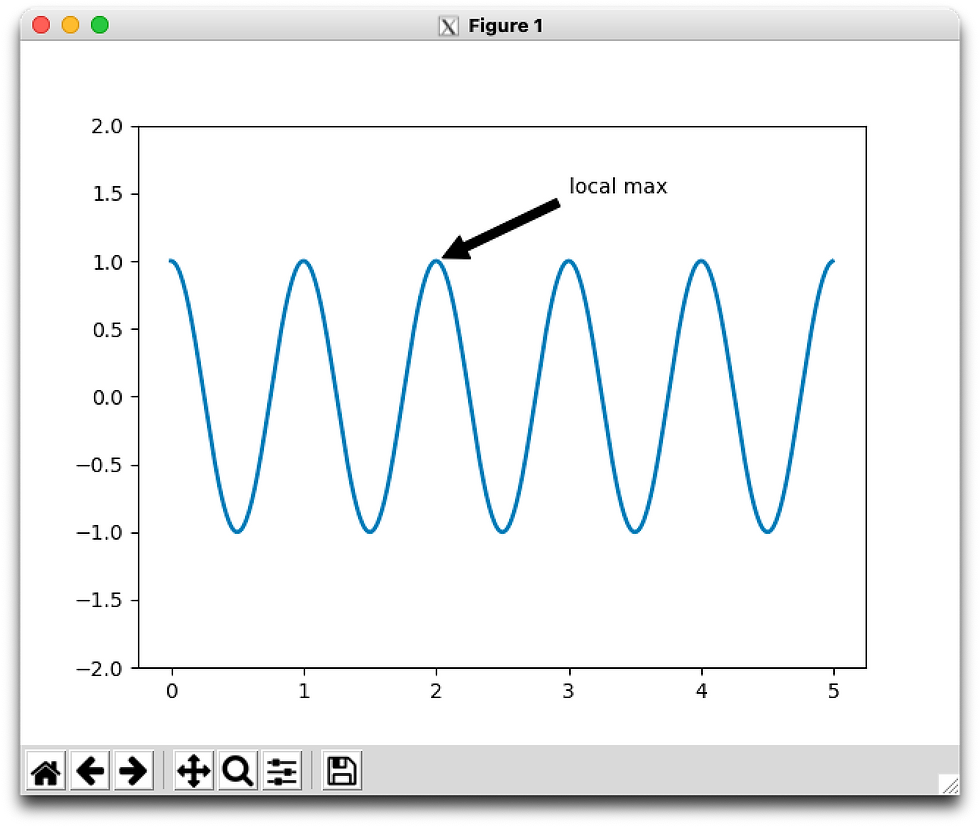
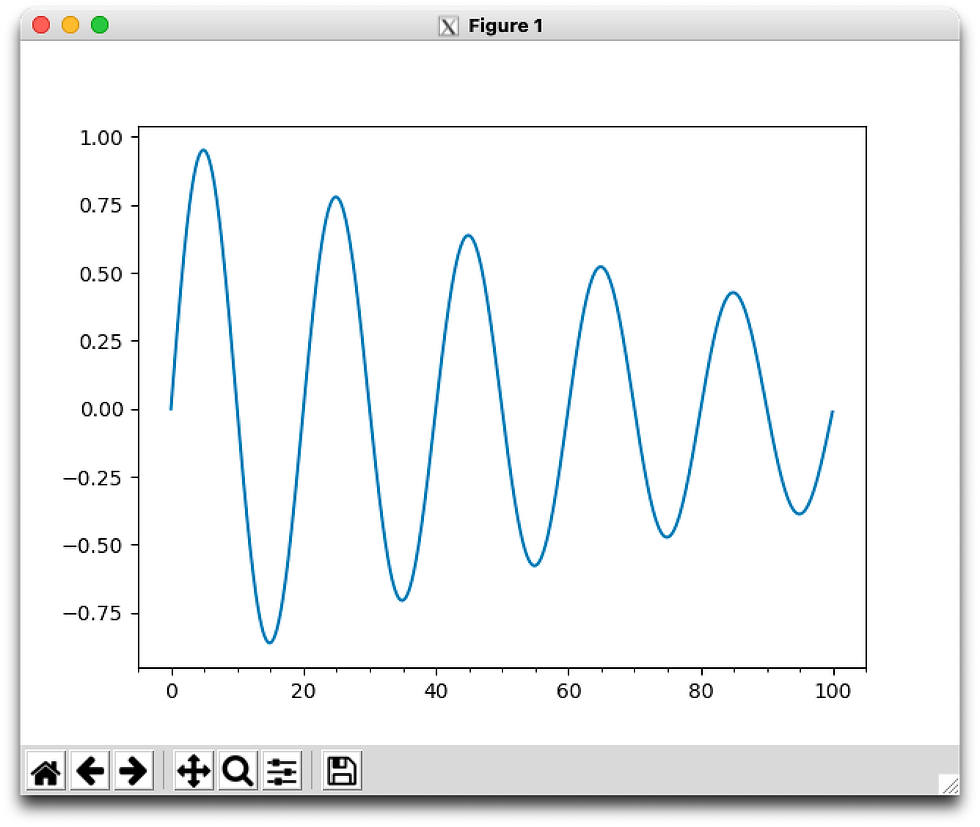
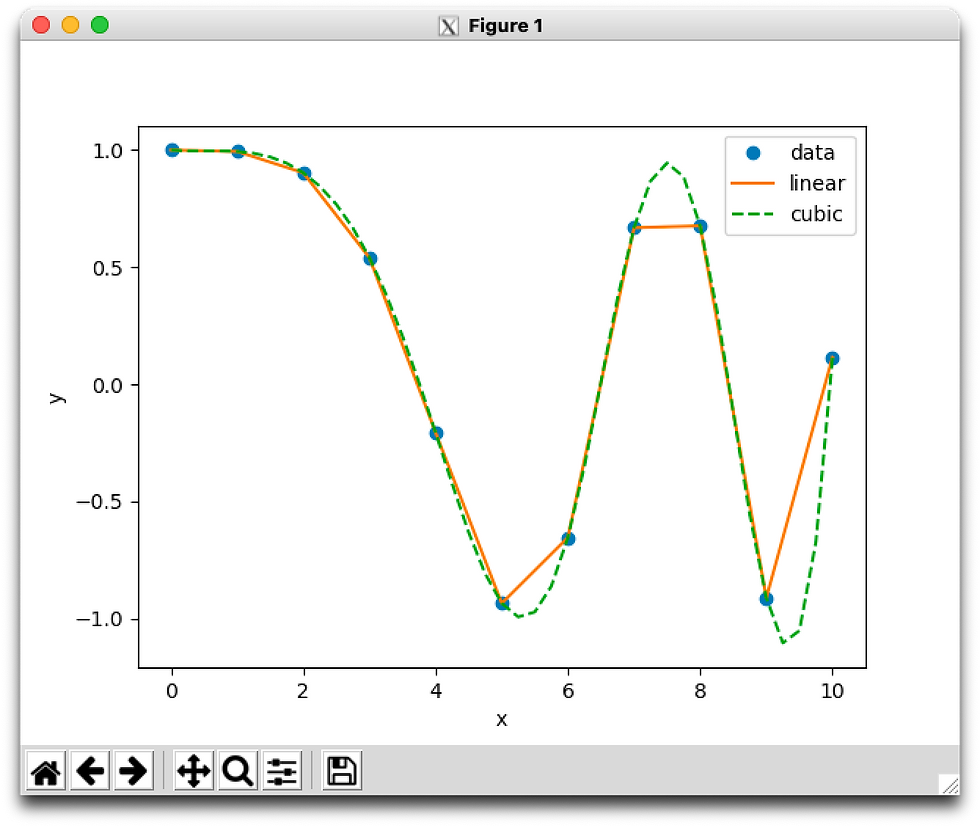
This section of the lab mostly focused on producing charts using Pyplot. Although I've used Pyplot before in conjunction with fitting data to probabilistic distributions, I was very impressed to see the amount of information that I can include in a graph, including subplots, legends, and even formal-appearing annotations.


8B:
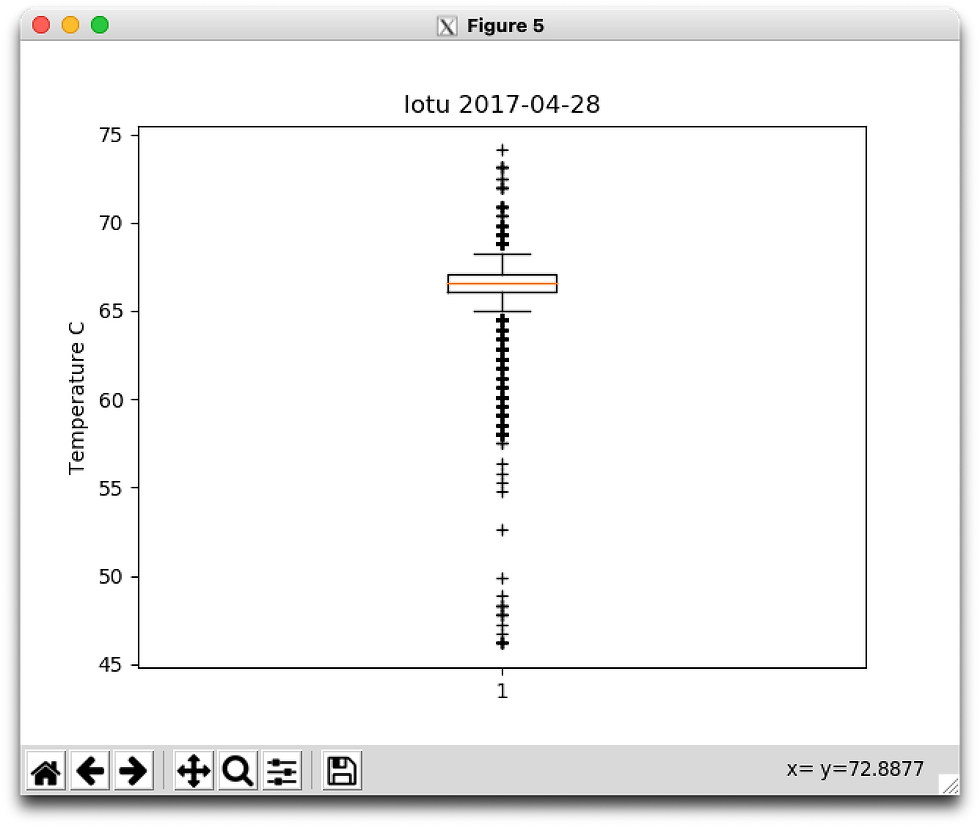
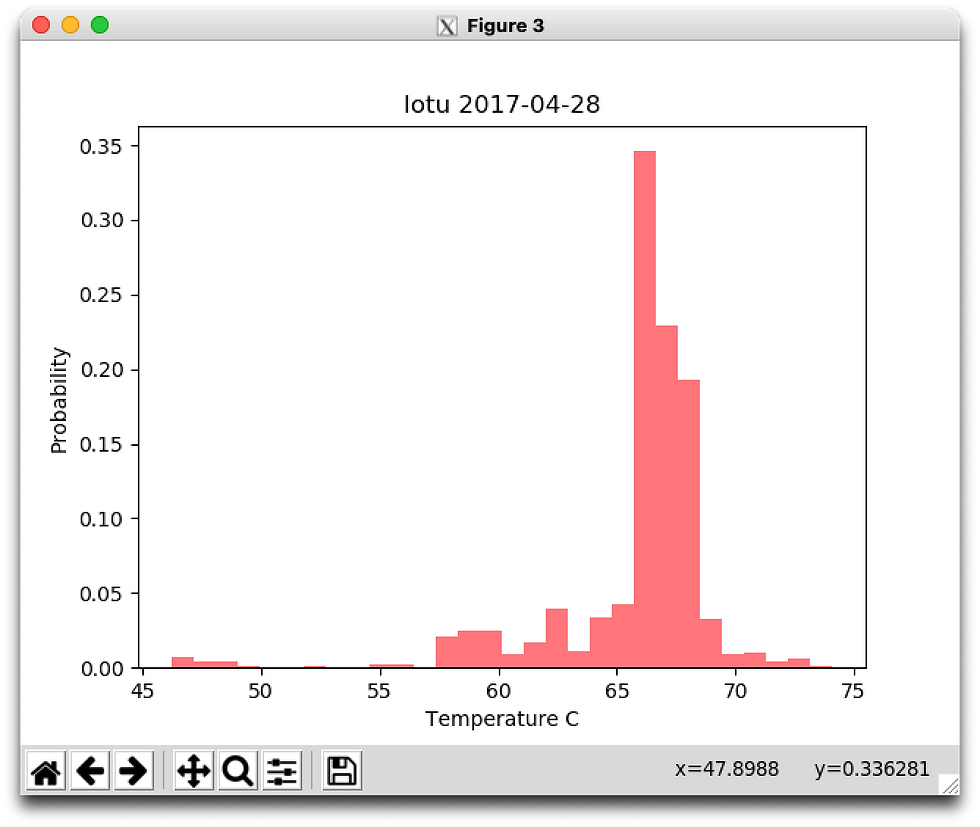
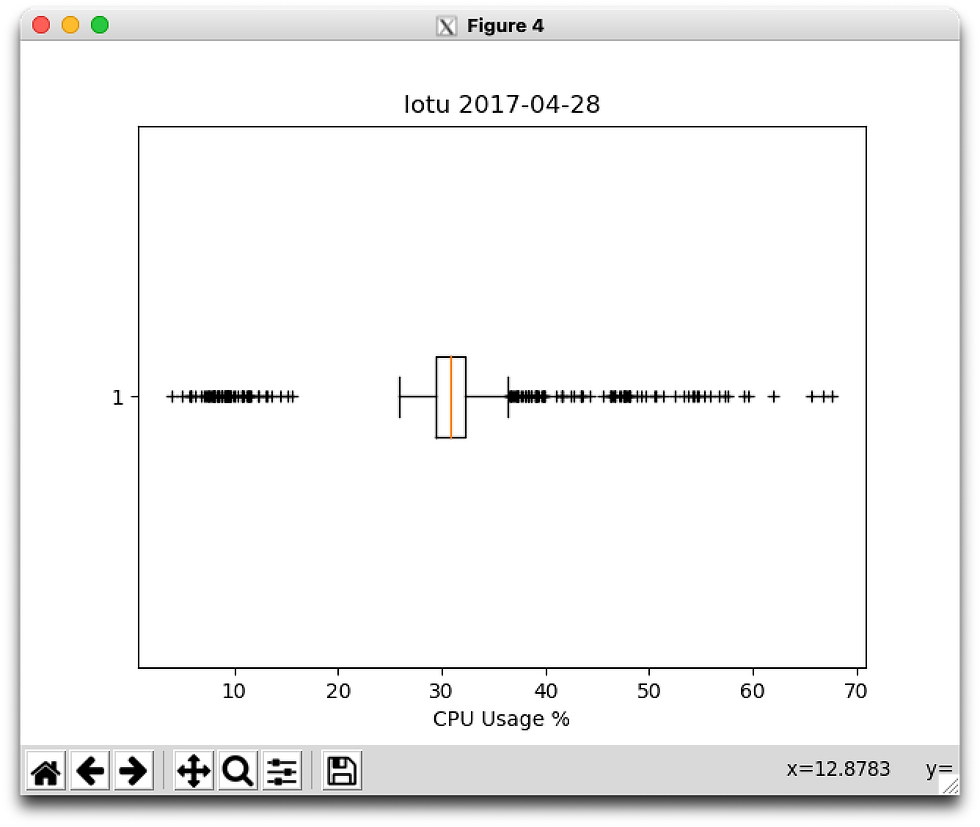
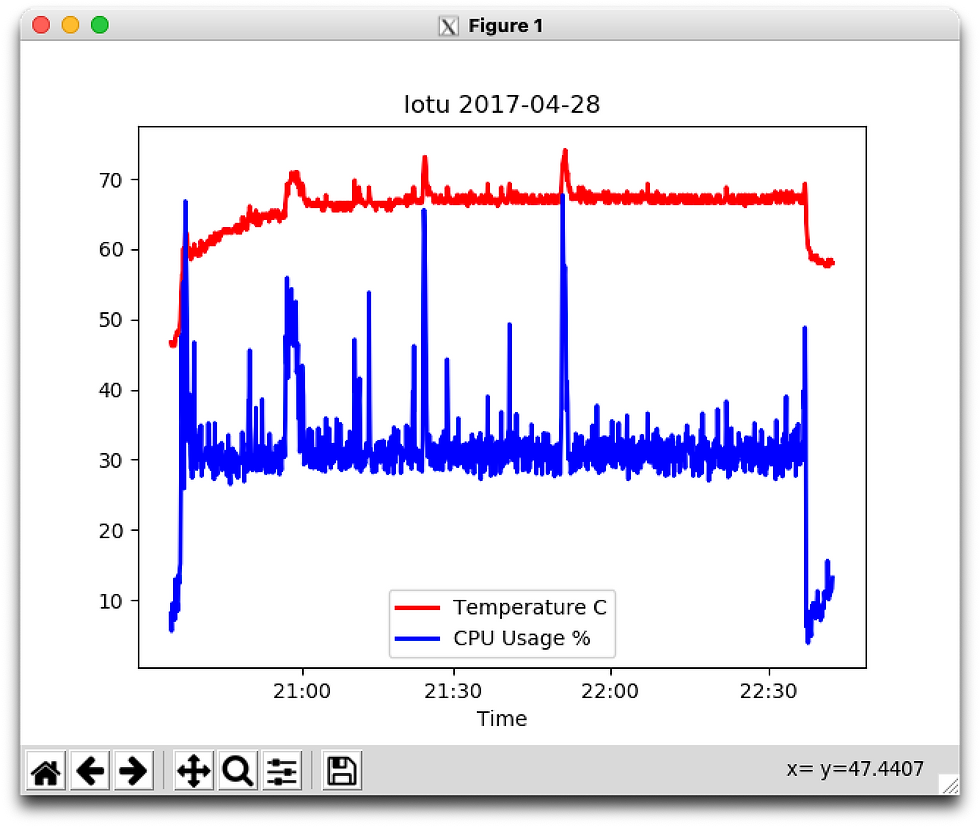
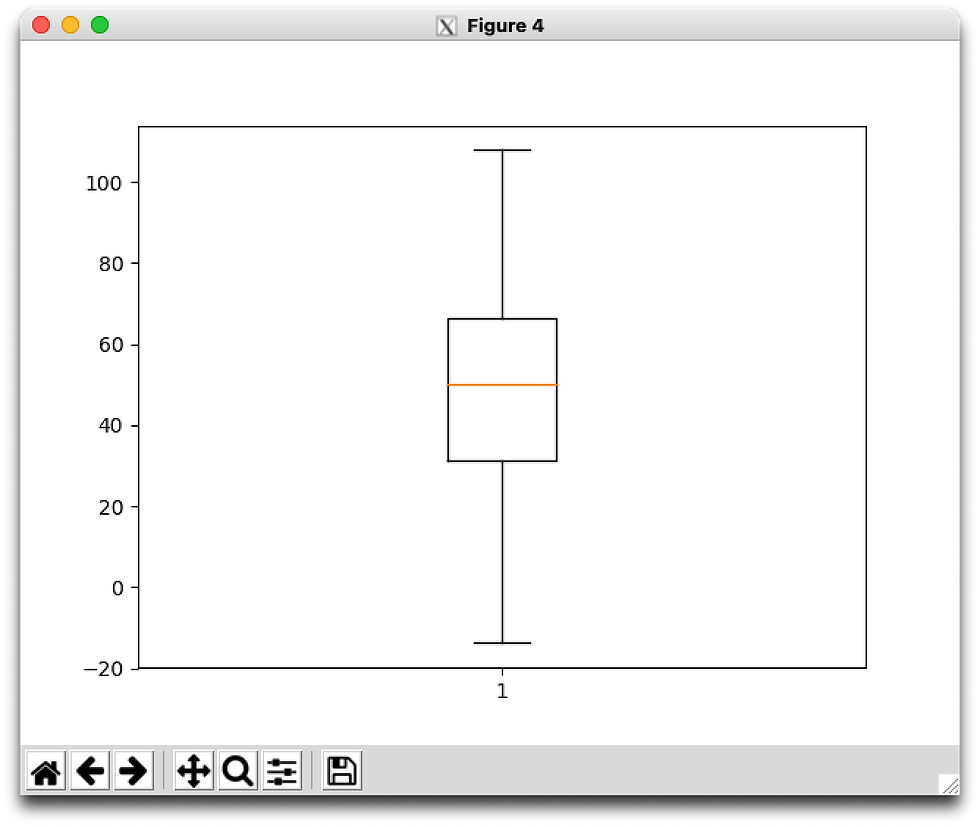
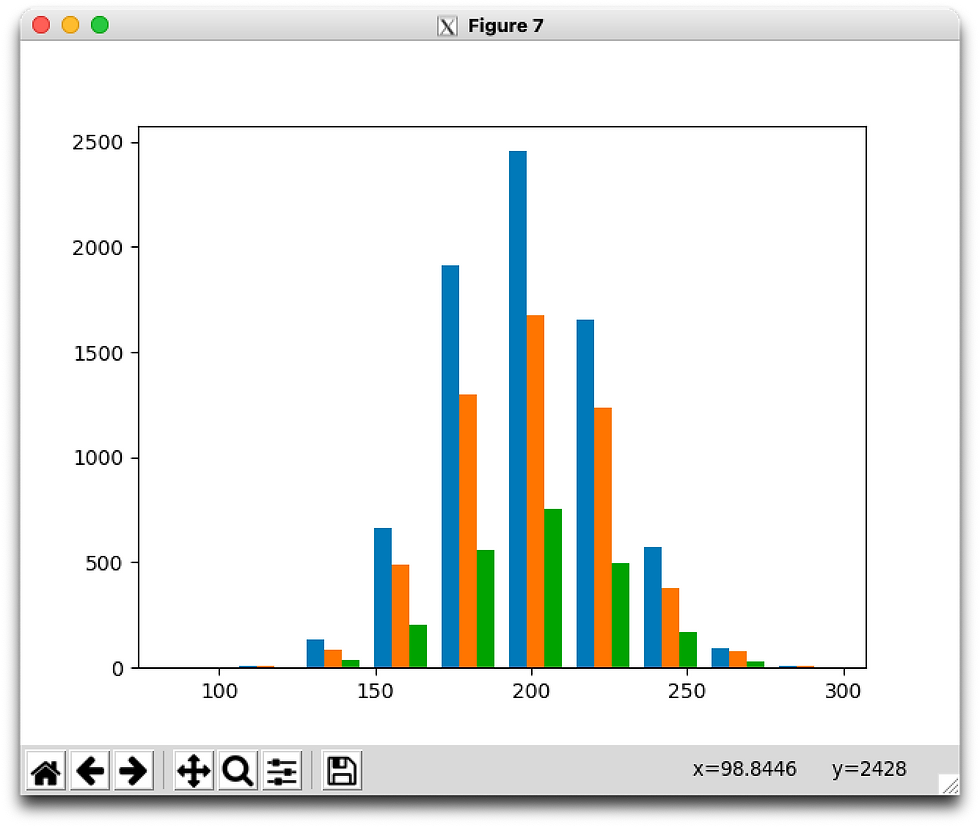
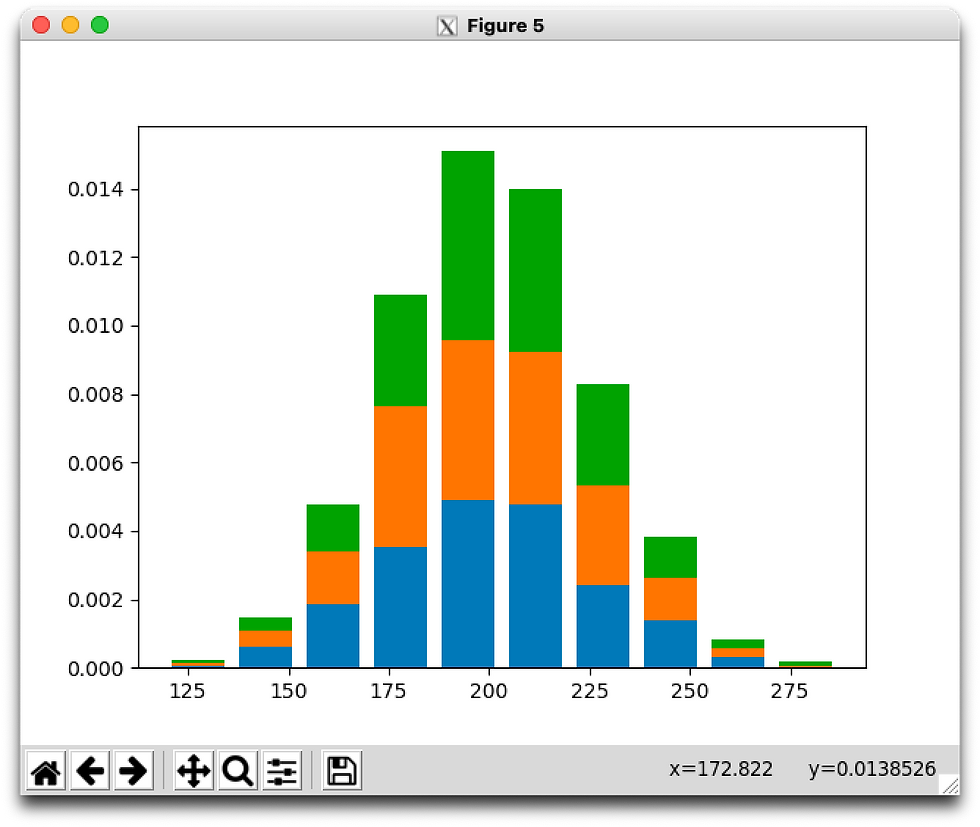
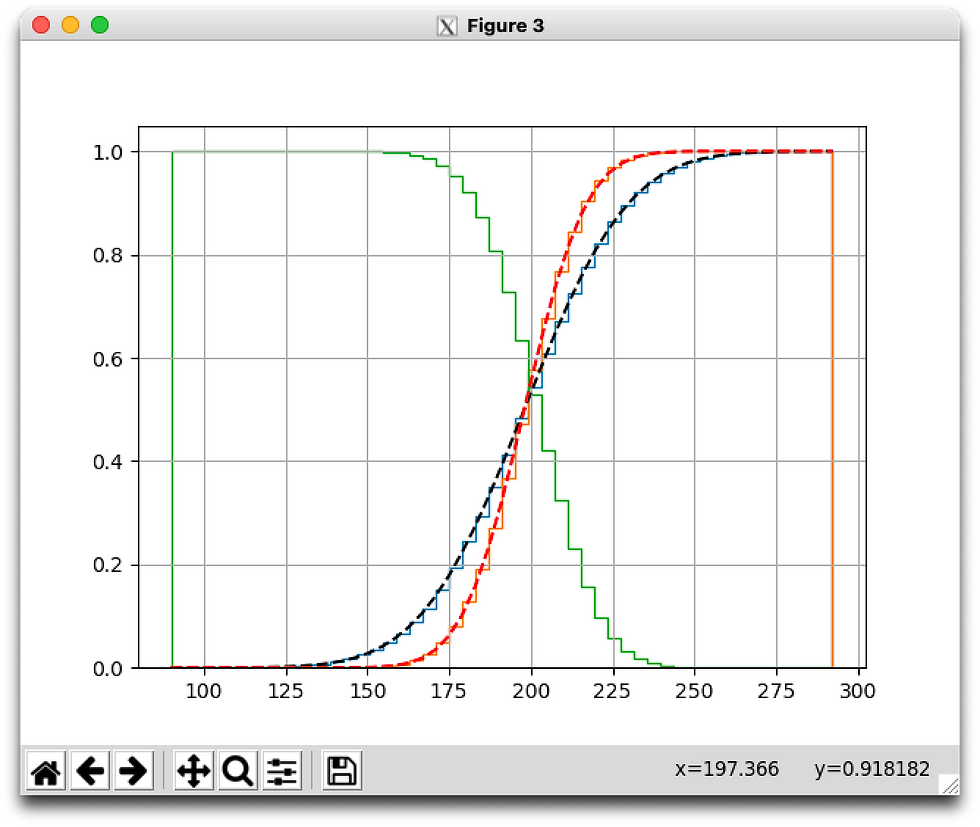
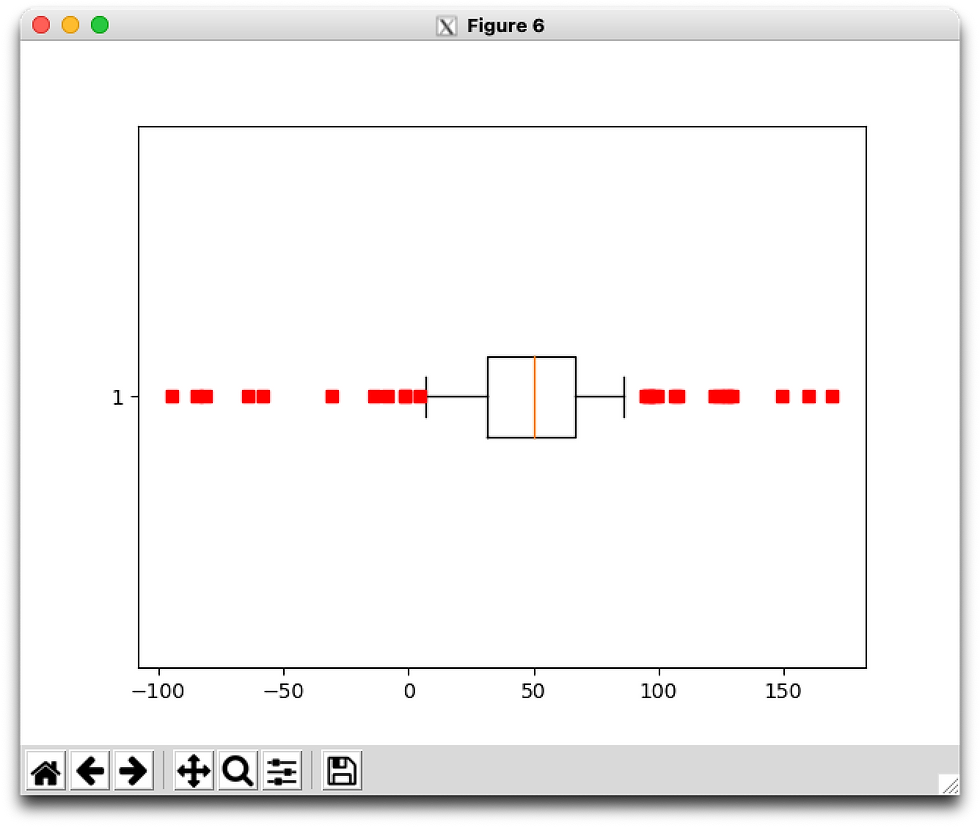
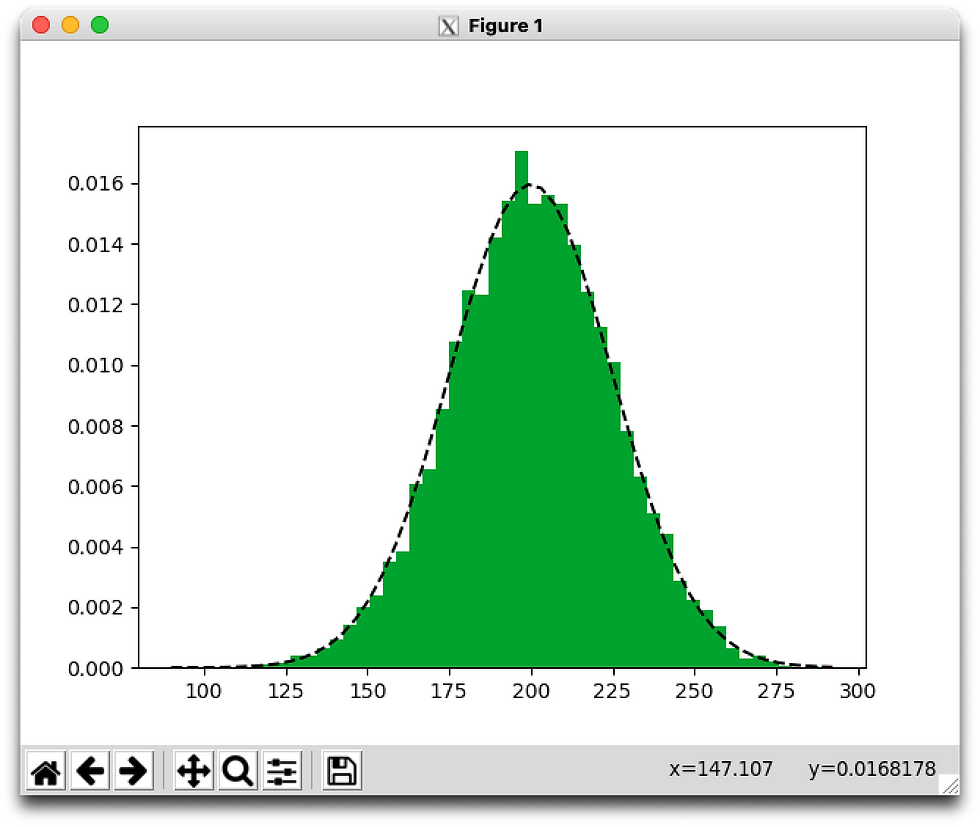
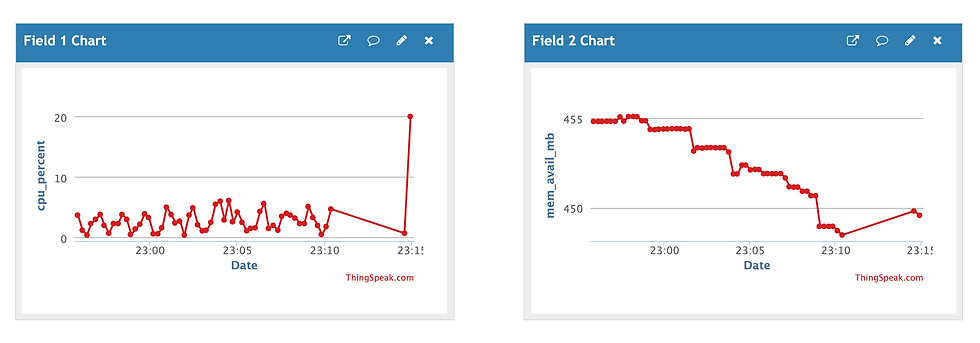
Plotting:


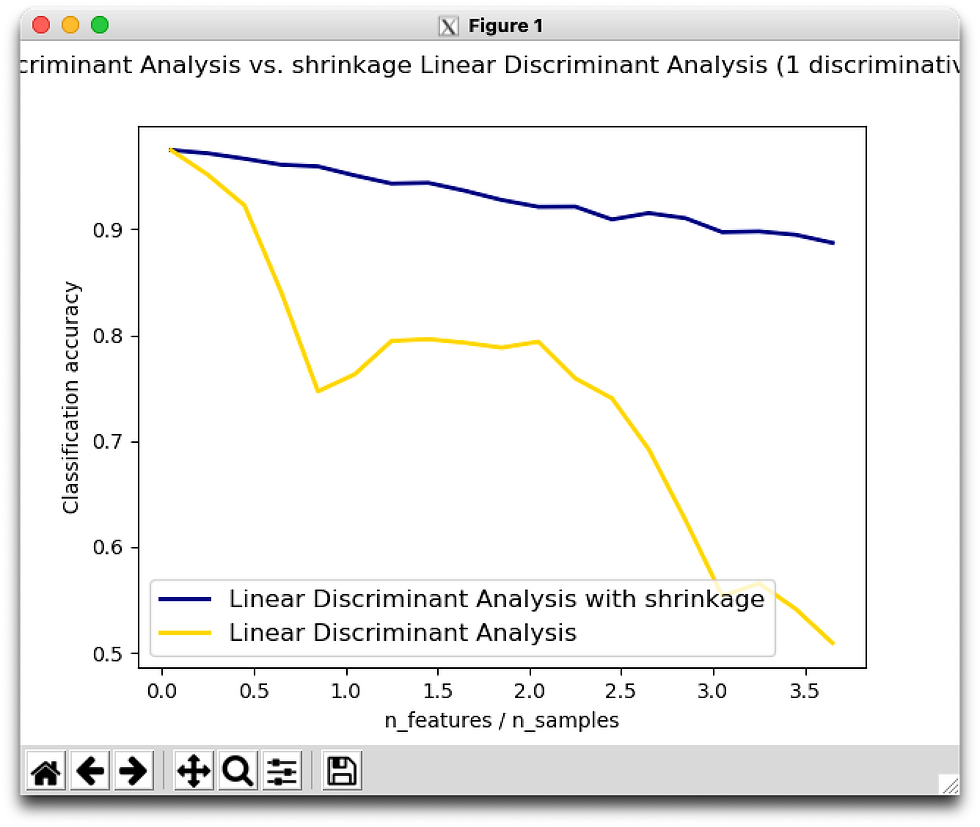


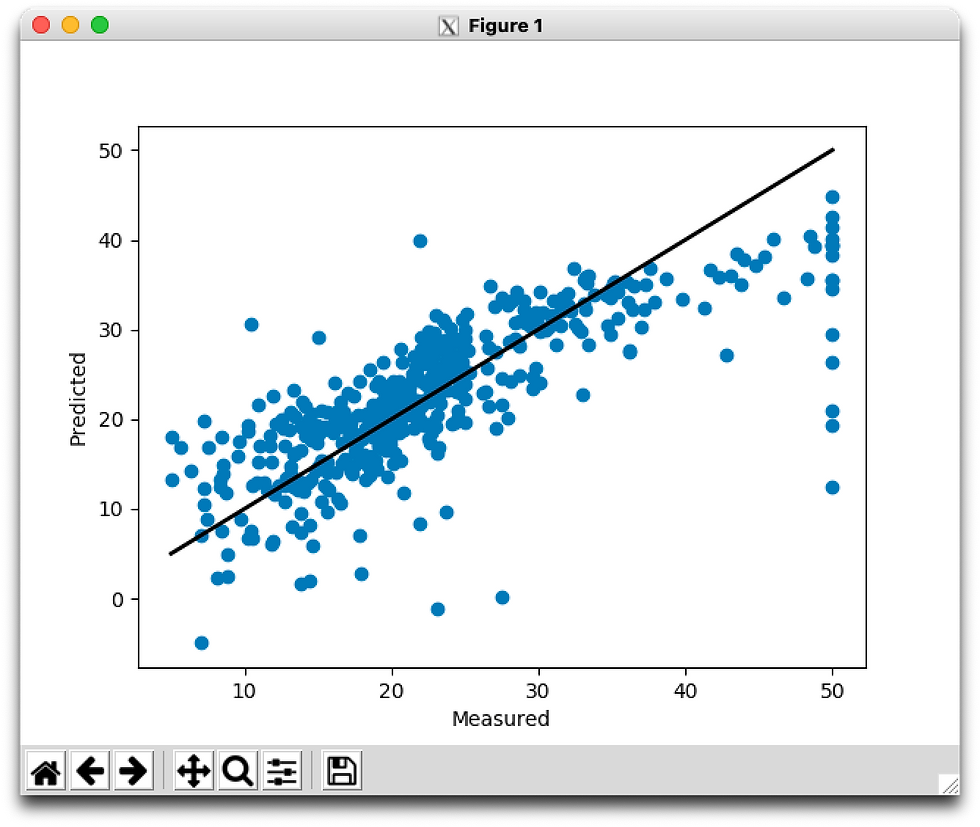
Cross Validation:


Keras & Tensorflow:
The accuracy (>70%) was surprisingly good, considering that the models were trained on a Pi in about 3 minutes.
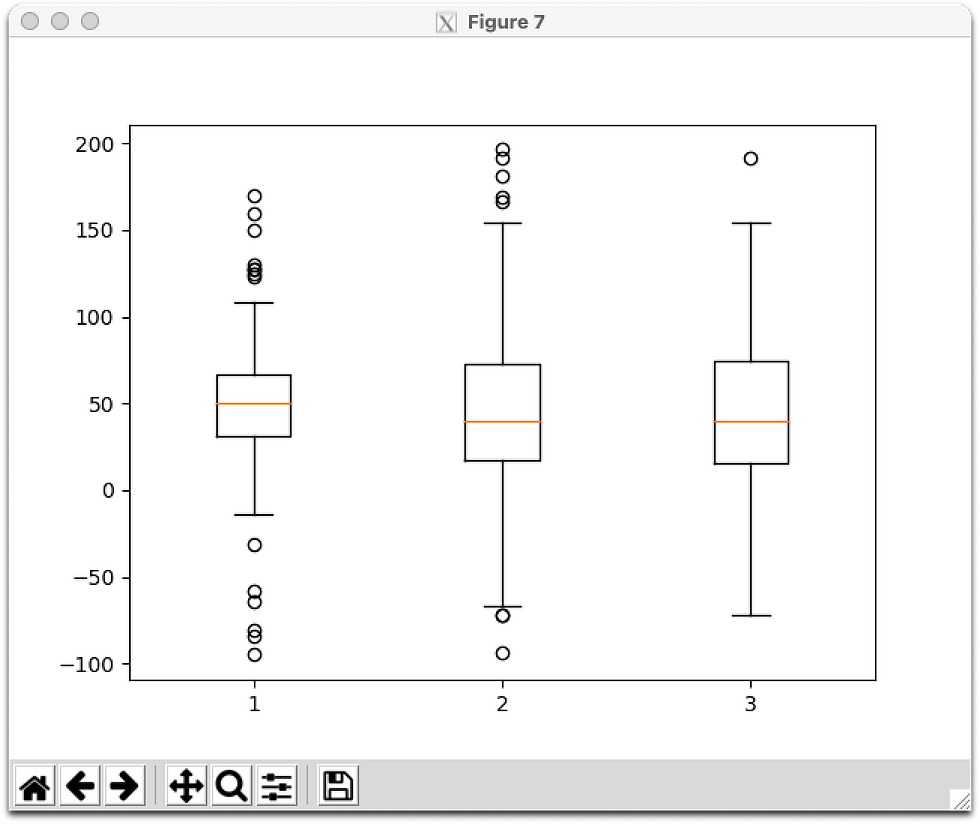
Titanic Example:

Overall:
This was a really great lab, allowing us to see the capabilities of the various frameworks and their potential. As I'm having to perform similar analysis and report results in other classes, I'll definitely be using these frameworks in my data processing methods to simplify (as opposed to outputting my data to CSV and then dealing with Microsoft Excel and the restrictions it imposes (such as a maximum number of data points when attempting to graph large amounts of data)).
Comments